Plot module: example damped vibration
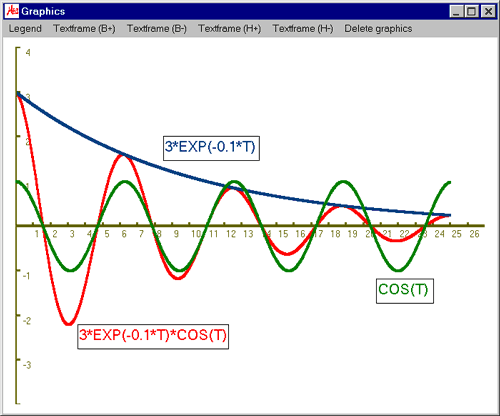
This example shows how to print the graph of the damped vibration

and its component parts

and

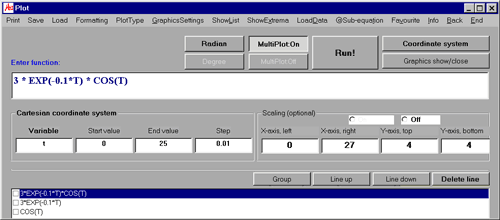
This is the input for MasterAllRound:

- Activate "Radian" by clicking on the button
- The variable is "t". The graph of the function is to be plotted from
"0" till "25" with a step width of "0.01":
- Variable: t
- Start value: 0
- End value: 25
- Step width: 0.01
- Scaling:
- X-axis, left: 0
- X-axis, right: 27
- Y-axis, top: 4
- Y-axis, bottom: 4
- Input of the function:
- Activate "Multiplot: On" by clicking on the button
and enter the first part of the equation:
- Do the same with the second part of the equation:

(To plot module)
(To MAR Plus)
|


