|
|
The plot module
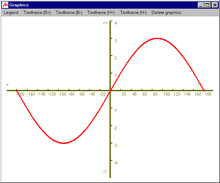
Use the plot module to print the graph of a function.
The handling of the plot module is very similar to that of the universal calculator.
Plain text input
In fact, the functionality of the universal calculator is also built into the plot module.
As with the universal calculator, you do not need programming experience or any training to plot functions.
MasterAllRound interprets your input.
All you have to do for curve sketching is:

- Declare the variable
- Enter start and end values as well as the step width
- Enter the function
- Finalise your input with the return key (or by clicking on the "Run!" button)
- The graph of the function will then be plotted.
Competitiveness and user friendliness
You'll find a lot of examples explaining the applications of MasterAllRound.
These examples, taken from various areas, demonstrate the competitiveness and user friendliness
of the plot module. Among others, you'll find described:

- How to print graphs of Fourier-series
- Examples from dynamics and vibration
- How to use graph sketching (the graphical visualization) for problem solving
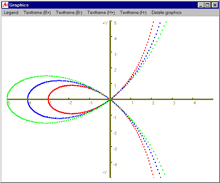
- Examples of graphical representation of functions in polar coordinates
Application examples
Matrix computations are widely used, e. g. in structural engineering and economics:
|
|


