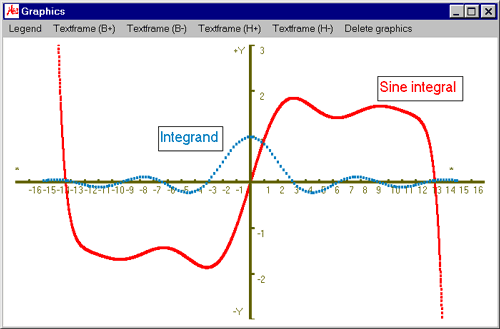
Plot module: example sine integral
The example below shows the application of factorials, constants and sub-equations:
The definite integral
 is the so-called sine integral with

Our task is to plot

As the equation Si(x) is quite long, we use sub-equations:
- t1= x - x^3/( 3*3! ) + x^5/( 5*5! ) - x^7/( 7*7!) + x^9/( 9*9! )
- t2= - x^11/( 11*11! ) + x^13/( 13*13! ) - x^15/( 15*15!) + x^17/( 17*17! )
- t3= - x^19/( 19*19! ) + x^21/( 21*21! ) - x^23/( 23*23!) + x^25/( 25*25! ) - x^27/( 27*27! )
The next steps are:
-
We declare the variable and enter start value, end value and step width. We intend to plot the graph
from -15 ≤ x ≤ +15. Note that the range of validity is dependent on the chosen
number of terms. You will see that, in this case, the validity range is samller
than the graph interval.
- Variable: x
- Start value: -15
- End value: 15
- Step width: 0.01
- We scale manually as below:
- X-axis, left: 17
- X-axis, right: 17
- Y-axis, top: 3
- Y-axis, bottom: 3
- And enter the function for Si(x):
- Sineintegral = t1 + t2 + t3 '@
We finalize the input with the return key and the graph of the function is then plotted:

(To plot module)
(To MAR Plus)
|

 is the so-called sine integral with
