Plot module: example strophoid
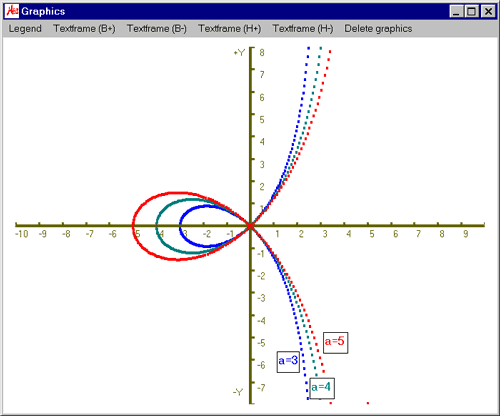
This example of the plot of a strophoid shows how to deal with polar coordinates.
The function of the strophoid is:


- We declare the constant:
- We activate the polar coordinate system by clicking on the "Coordinate system" button
- For the plot we have choosen the following input parameters:
- Variable: phi
- Start value: 0
- End value: 6.28
- Step width: 0.01
- We enter the function:
- strophoide=-a*cos(2*phi)/cos(phi)
- We finalize the input with the return key or by clicking on the "Run!" button
- The function is then plotted

The graph shows the strophoid for different values of a.
(To plot module)
(To MAR Plus)
|


